TradingView vs Trendspider: What’s the Best Trading Platform for Your Strategy?
Step into the dynamic world of online trading with a face-off between two heavyweights: TradingView vs Trendspider. These platforms aren’t just tools; they’re strategic partners in your trading journey. TradingView offers a vibrant community where traders share real-time insights, while Trendspider’s AI-driven trendline detection and backtesting bring automation to the forefront.
Imagine TradingView as your virtual trading hub. Analyze stock patterns, overlay indicators, and engage in real-time discussions about market trends. On the flip side, Trendspider introduces AI-powered trendline identification. It draws lines for you and backtests strategies using historical data, revealing insights from the past.
In this comparison, we’ll uncover the strengths of both platforms and guide you towards your trading triumph. Get ready to pick the platform that aligns with your strategy, elevating your trading game to new heights.
Overview of TradingView and Trendspider
TradingView and Trendspider are two distinct platforms that cater to traders and investors seeking advanced tools to navigate the financial markets.
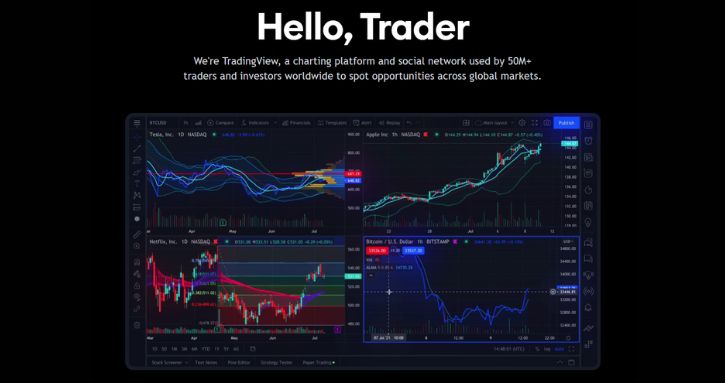
TradingView is renowned for its intuitive charting interface and a vast community of traders who share insights and analysis. With a wide range of charting tools, technical indicators, and drawing features, TradingView empowers users to conduct in-depth technical analysis and visualize market trends. The platform’s social networking aspect allows traders to share ideas, strategies, and chart analyses with the community, fostering collaborative learning and idea exchange.

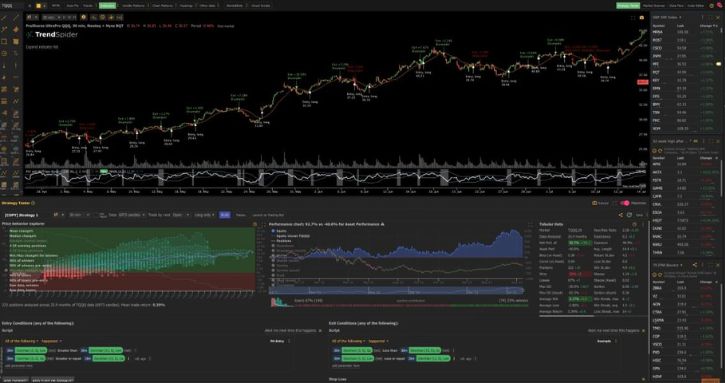
On the other hand, Trendspider is a cutting-edge platform that leverages automation and artificial intelligence for technical analysis. This platform focuses on identifying and highlighting chart patterns, trendlines, and crucial support and resistance levels. Trendspider’s algorithmic capabilities streamline the technical analysis process by automatically detecting patterns and providing traders with actionable insights. Additionally, the platform offers backtesting and scenario analysis, enabling traders to refine and validate their strategies based on historical data.

Both TradingView and Trendspider serve as indispensable tools in a trader’s arsenal, each catering to different needs within the spectrum of technical analysis and strategy development. Understanding the specific features and advantages of each platform will empower traders to make informed choices based on their trading styles and goals.
Charting and Technical Analysis: TradingView vs Trendspider
When it comes to charting and technical analysis, TradingView and Trendspider offer unique sets of features that cater to traders’ diverse needs. Here’s a comparison of their charting capabilities:
TradingView
TradingView is widely known for its comprehensive and user-friendly charting tools. It provides an extensive library of technical indicators, overlays, and drawing tools, allowing traders to conduct in-depth analysis on price movements. The platform offers customizable timeframes, from intraday to long-term, and supports various chart types, including candlestick, line, bar, and more.
Key Features
Technical Indicators: TradingView offers a vast array of technical indicators, from moving averages to oscillators, helping traders analyze trends and potential entry/exit points.
Drawing Tools: Traders can draw trendlines, shapes, and annotations on charts, enhancing their ability to identify patterns and key levels.
Multiple Charts: The platform allows traders to view multiple charts simultaneously, making it easier to analyze correlated assets and identify trading opportunities.
Community Insights: TradingView’s social features enable users to access community-generated ideas and analysis, expanding their perspective on market trends.
Trendspider
Trendspider stands out with its automation-driven approach to technical analysis. The platform’s algorithms automatically identify trendlines, support/resistance levels, and chart patterns, streamlining the analysis process.
Key Features
Automated Analysis: Trendspider’s algorithms detect and highlight trendlines, channels, and candlestick patterns, saving traders time and effort in manual analysis.
Dynamic Alerts: The platform offers dynamic alerts that trigger when price breaches trendlines or key levels, notifying traders of potential breakout or reversal opportunities.
Raindrop Charts: Trendspider introduces Raindrop charts, which consolidate trading activity within specified timeframes, aiding in spotting trends and liquidity patterns.
Backtesting: Traders can backtest their strategies using historical data, helping them assess the effectiveness of their trading plans.
Real-Time Data and Market Insights
TradingView
TradingView prides itself on providing traders with up-to-the-minute real-time data and a wealth of market insights to support their decision-making. Here’s how it excels in this regard:
- Real-Time Data: TradingView offers real-time data across a wide range of asset classes, including stocks, forex, cryptocurrencies, indices, commodities, and more. This ensures that traders have access to the most current price movements and market information.
- Advanced Charting: The platform’s advanced charting tools allow traders to visualize real-time market data through customizable charts. These charts can be tailored to specific timeframes, styles, and preferences.
- Technical Indicators: TradingView provides an extensive library of technical indicators that traders can overlay on their charts. These indicators help in analyzing real-time market trends, identifying potential entry and exit points, and making informed trading decisions.
- Social Insights: TradingView’s social networking aspect enables traders to access real-time insights and analyses from the community. Users can follow other traders, share their ideas, and engage in discussions, enhancing their understanding of market sentiment.
TrendSpider
TrendSpider, known for its automation-driven approach to technical analysis, also offers real-time data and market insights to traders:
- Real-Time Data: TrendSpider provides real-time data for the asset classes it supports, including stocks, options, futures, and forex. This ensures that traders have access to the latest price data and market developments.
- Automated Analysis: The standout feature of TrendSpider is its automated analysis capabilities. The platform uses artificial intelligence to automatically identify and draw trendlines, support and resistance levels, and chart patterns in real-time.
- Dynamic Alerts: TrendSpider offers dynamic alerts that trigger when price breaches trendlines or key levels. This real-time alert system helps traders stay informed about potential breakout or reversal opportunities.
- Raindrop Charts: TrendSpider introduces Raindrop charts, which consolidate trading activity within specified timeframes. This unique chart type aids in spotting trends and liquidity patterns as they develop in real-time.
Strengths and Weaknesses: TradingView vs TrendSpider
TradingView
Strengths:
- Community Engagement: TradingView shines with its vibrant community. Traders can share insights, strategies, and analyses in real time, fostering collaboration and learning.
- Advanced Charting Tools: TradingView offers a comprehensive selection of technical studies and drawing tools, allowing for intricate chart analysis. Traders can customize their charts extensively.
- Diverse Asset Coverage: The platform provides access to a wide range of asset classes, including stocks, forex, cryptocurrencies, indices, and commodities, making it suitable for diversified trading strategies.
- Web-Based Platform: TradingView is accessible via a web-based interface, eliminating the need for downloads or installations. Traders can access their accounts from any device with an internet connection.
Weaknesses:
- Limited Broker Integration: While TradingView offers brokerage integration, the number of supported brokers may be more limited compared to other platforms, which could be a drawback for some traders.
- Data Latency: In some cases, real-time data on TradingView may experience slight latency, which can impact split-second trading decisions.
TrendSpider
Strengths:
- Automated Technical Analysis: TrendSpider excels in automated analysis. The platform uses artificial intelligence to identify and draw trendlines, support/resistance levels, and chart patterns automatically.
- Unique Chart Types: The introduction of Raindrop charts and automation-driven insights provides traders with a different perspective on market behavior, potentially uncovering new trading opportunities.
- Real-Time Alerts: TrendSpider offers dynamic alerts that trigger when prices breach trendlines or key levels, keeping traders informed about potential breakout or reversal opportunities.
- Risk Management: The platform provides tools for visualizing potential profit and loss scenarios, enhancing risk management capabilities.
Weaknesses:
- Learning Curve: The comprehensive features of TrendSpider may present a learning curve, especially for new traders who are unfamiliar with automation-driven technical analysis.
- Limited Asset Classes: TrendSpider’s asset coverage is more focused, primarily supporting stocks, options, futures, and forex. Traders looking for exposure to a broader range of asset classes may find it lacking.
Which is Better?
In the dynamic world of trading platforms, both TradingView and TrendSpider bring a unique twist to the table, leveraging shared features in distinct and exciting ways.
TradingView takes on a social media vibe, where it’s not just about charts and numbers – it’s about community. Think of it as the Twitter of trading. Traders can share ideas, annotated charts, and even new indicators with the entire community. The result? A buzzing hub of fresh trading perspectives, injecting a burst of energy into your trading routine.
But don’t let the community dazzle distract you from TradingView’s indicator prowess. It offers a treasure trove of ready-to-use technical studies and, brace yourself, a treasure map to thousands more indicators posted by fellow traders. And if you’re feeling adventurous, you can tap into Pine script, a coding language that lets you build custom studies or craft intricate trading signals.
Now, let’s talk TrendSpider. It’s like the Picasso of chart automation. While you might expect to manually scribble on charts, TrendSpider takes the reins and does it for you. Fancy an AI-powered suggestion for Fibonacci retracements? TrendSpider’s got your back. Need a hand identifying potential support, resistance, or those elusive candlestick patterns? You guessed it, TrendSpider’s AI can do that too. It’s like having a trading wizard in your corner, pointing out opportunities you might have missed.
So, while both platforms share a few tricks, they’re doing their magic in vastly different ways. The choice? Yours to make, depending on whether you’re more of a social trader or a chart whisperer.
Is TradingView or TrendSpider for you?
TrendSpider plays its cards right by targeting distinct customer segments. Their Premium plan is like a secret weapon for active part-time traders who balance trading with their day job. The Elite subscription steps it up a notch, offering experienced traders advanced real-time market data that’s like a secret handshake among pros. Then there’s the Advanced subscription, a paradise for professional full-time traders who crave the most sophisticated tools to empower their trading journey. Modest Money agrees and recommends this tiered approach, suggesting traders start with Premium and level up as their profits soar.
But here’s the twist – TrendSpider doesn’t offer a free basic option. However, during the 7-day free trial, you won’t be charged. No haggling for fee rebates, unlike some other services. Even cooler? If you decide the magic isn’t for you, canceling is a breeze – no need to make a call or send an email. Just a few clicks in your account settings.
TrendSpider suits Intermediate to Advanced investors who’ve mastered technical analysis and thrive on real-time market data. If you’re not in this lane, you might want to take a different exit.
On the TradingView side, they’ve got a strategy too. Their Basic plan welcomes new investors with open arms. Pro plan? That’s the sweet spot for part-time traders who’ve dipped their toes in the waters of experience. Pro+ (or TradingView Pro Plus) is like the turbo boost for day-traders hungry to level up their trading game. And the Premium plan? It’s the heavyweight champion, designed for the full-time traders who make a living from the art of trading.
TradingView knows its crowd well – it shines brightest for Beginner to Intermediate traders. If you’re a trading newbie, someone still figuring out candlestick patterns, or just getting acquainted with the day trading rules, TradingView is your open door to the trading world. If you want to explore other related platforms you may also check out TradingView vs Thinkorswim.
Final Thoughts
As we conclude this journey of discovery, remember that both TradingView and TrendSpider offer unique paths to your trading triumph. Whether you prefer to be part of a vibrant community or harness the power of AI-driven automation, the choice is yours. So, step into the dynamic world of trading platforms and choose the one that best aligns with your strategy, propelling your trading game to new heights.
